Cluster Analysis : Finding groups of objects such that the objects in a group will be similar (or related) to one another and different from (or unrelated to) the objects in other groups.
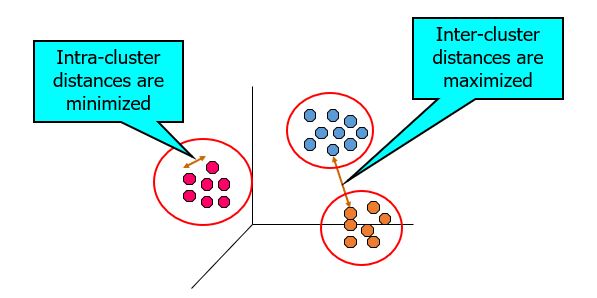
Table of Contents
Examples of Clustering Applications
- Marketing: Help marketers discover distinct groups in their customer bases, and then use this knowledge to develop targeted marketing programs
- Land use: Identification of areas of similar land use in an earth observation database
- Insurance: Identifying groups of motor insurance policy holders with a high average claim cost
- City-planning: Identifying groups of houses according to their house type, value, and geographical location
- Earth-quake studies: Observed earth quake epicenters should be clustered along continent faults
What is not Cluster Analysis?
- Supervised classification
- Have class label information
- Simple segmentation
- Dividing students into different registration groups alphabetically, by last name
- Results of a query
- Groupings are a result of an external specification
What Is Good Clustering?
- A good clustering method will produce high quality clusters with
- high intra-class similarity
- low inter-class similarity
- The quality of a clustering result depends on both the similarity measure used by the method and its implementation
- The quality of a clustering method is also measured by its ability to discover some or all of the hidden patterns
Measure the Quality of Clustering
- Dissimilarity/Similarity metric: Similarity is expressed in terms of a distance function, typically metric: d(i, j)
- There is a separate “quality” function that measures the “goodness” of a cluster.
- The definitions of distance functions are usually very different for interval-scaled, boolean, categorical, ordinal ratio, and vector variables.
- Weights should be associated with different variables based on applications and data semantics.
- It is hard to define “similar enough” or “good enough”
- the answer is typically highly subjective.
Requirements of Clustering in Data Mining
- Scalability
- Ability to deal with different types of attributes
- Discovery of clusters with arbitrary shape
- Minimal requirements for domain knowledge to determine input parameters
- Able to deal with noise and outliers
- Insensitive to order of input records
- High dimensionality
- Incorporation of user-specified constraints
- Interpretability and usability
Type of data in clustering analysis
- Interval-scaled variables
- Binary variables
- Nominal, ordinal, and ratio variables
- Variables of mixed types
Interval-valued variables
- Standardize data
- Calculate the mean absolute deviation:

- where

- Calculate the standardized measurement (z-score)

- Using mean absolute deviation is more robust than using standard deviation
Similarity and Dissimilarity Between Objects
- Distances are normally used to measure the similarity or dissimilarity between two data objects
- Some popular ones include: Minkowski distance:

where i = (xi1, xi2, …, xip) and j = (xj1, xj2, …, xjp) are two p-dimensional data objects, and q is a positive integer
- If q = 1, d is Manhattan distance

Binary Variables
- A contingency table for binary data

- Distance measure for symmetric binary variables:

- Distance measure for asymmetric binary variables:

-
- Jaccard coefficient (similarity measure for asymmetric binary variables):

Nominal Variables
- A generalization of the binary variable in that it can take more than 2 states, e.g., red, yellow, blue, green
- Method 1: Simple matching
- m: # of matches, p: total # of variables

- Method 2: use a large number of binary variables
- creating a new binary variable for each of the M nominal states
Ordinal Variables
- An ordinal variable can be discrete or continuous
- Order is important, e.g., rank
- Can be treated like interval-scaled
- replace xif by their rank
- map the range of each variable onto [0, 1] by replacing i-th object in the f-th variable by

- compute the dissimilarity using methods for interval-scaled variables
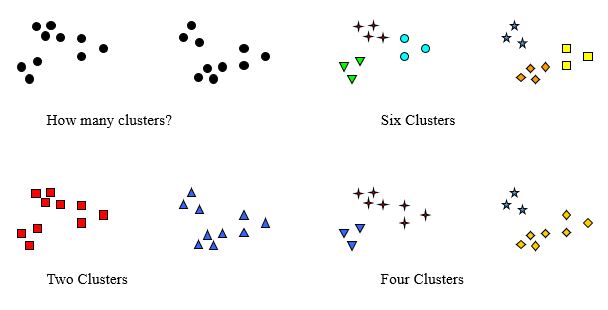
Notion of a Cluster can be Ambiguous
Types of Clusterings
- A clustering is a set of clusters
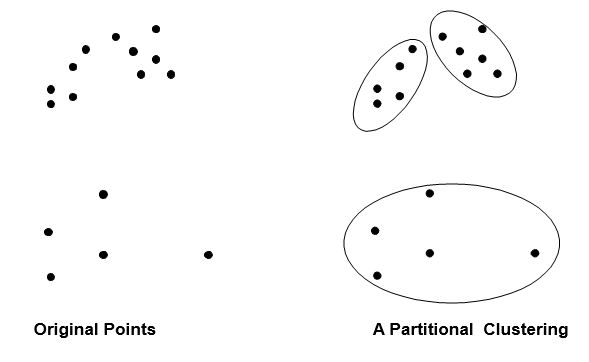
- An important distinction among types of clusterings : hierarchical and partitional sets of clusters
- Partitional Clustering
- A division data objects into non-overlapping subsets (clusters) such that each data object is in exactly one subset
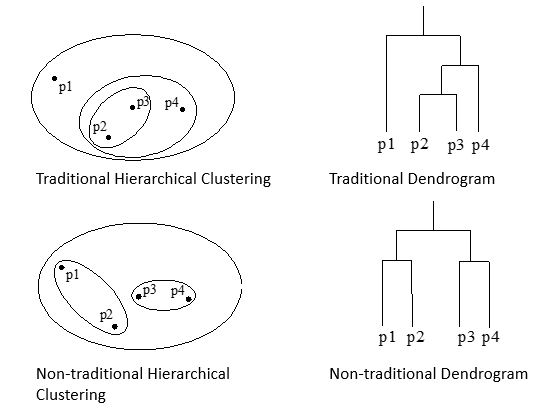
- Hierarchical clustering
- A set of nested clusters organized as a hierarchical tree
Partitional Clustering
Hierarchical Clustering
Other Distinctions Between Sets of Clusters
- Exclusive versus non-exclusive
- In non-exclusive clusterings, points may belong to multiple clusters.
- Can represent multiple classes or ‘border’ points
- Fuzzy versus non-fuzzy
- In fuzzy clustering, a point belongs to every cluster with some weight between 0 and 1
- Weights must sum to 1
- Probabilistic clustering has similar characteristics
- Partial versus complete
- In some cases, we only want to cluster some of the data
- Heterogeneous versus homogeneous
- Cluster of widely different sizes, shapes, and densities
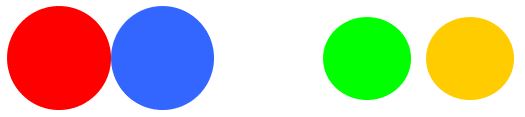
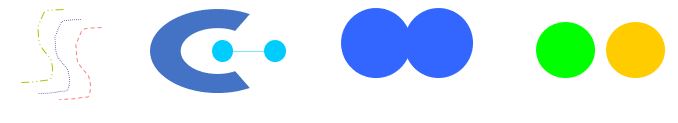
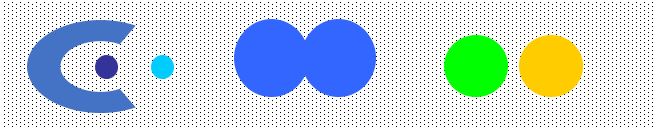
Types of Clusters
Clusters can be of many types:
- Well-separated clusters
- Center-based clusters
- Contiguous clusters
- Density-based clusters
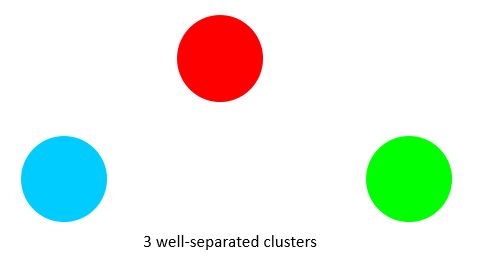
Types of Clusters: Well-Separated
A cluster is a set of points such that any point in a cluster is closer (or more similar) to every other point in the cluster than to any point not in the cluster.
Types of Clusters: Center-Based
- A cluster is a set of objects such that an object in a cluster is closer (more similar) to the “center” of a cluster, than to the center of any other cluster
- The center of a cluster is often a centroid, the average of all the points in the cluster, or a medoid, the most “representative” point of a cluster
Types of Clusters: Contiguity-Based
- A cluster is a set of points such that a point in a cluster is closer (or more similar) to one or more other points in the cluster than to any point not in the cluster.
Types of Clusters: Density-Based
- A cluster is a dense region of points, which is separated by low-density regions, from other regions of high density.
- Used when the clusters are irregular or intertwined, and when noise and outliers are present.
Types of Clusters: Conceptual Clusters
Shared Property or Conceptual Clusters
- Finds clusters that share some common property or represent a particular concept.
Types of Clusters: Objective Function
Clusters Defined by an Objective Function
- Finds clusters that minimize or maximize an objective function.
- Enumerate all possible ways of dividing the points into clusters and evaluate the `goodness’ of each potential set of clusters by using the given objective function. (NP Hard)
- Can have global or local objectives.
- Hierarchical clustering algorithms typically have local objectives
- Partitional algorithms typically have global objectives
- A variation of the global objective function approach is to fit the data to a parameterized model.
- Parameters for the model are determined from the data.
- Mixture models assume that the data is a ‘mixture’ of a number of statistical distributions.
- Map the clustering problem to a different domain and solve a related problem in that domain
- Proximity matrix defines a weighted graph, where the nodes are the points being clustered, and the weighted edges represent the proximities between points
- Clustering is equivalent to breaking the graph into connected components, one for each cluster.
- Want to minimize the edge weight between clusters and maximize the edge weight within clusters
Important Characteristics of the Input Data
- Type of proximity or density measure
- This is a derived measure, but central to clustering
- Attribute type
- Dictates type of similarity
- Type of Data
- Dictates type of similarity
- Other characteristics, e.g., autocorrelation
- Dimensionality
- Noise and Outliers
- Type of Distribution